1
Notifications
Keep track of changes that need attention.
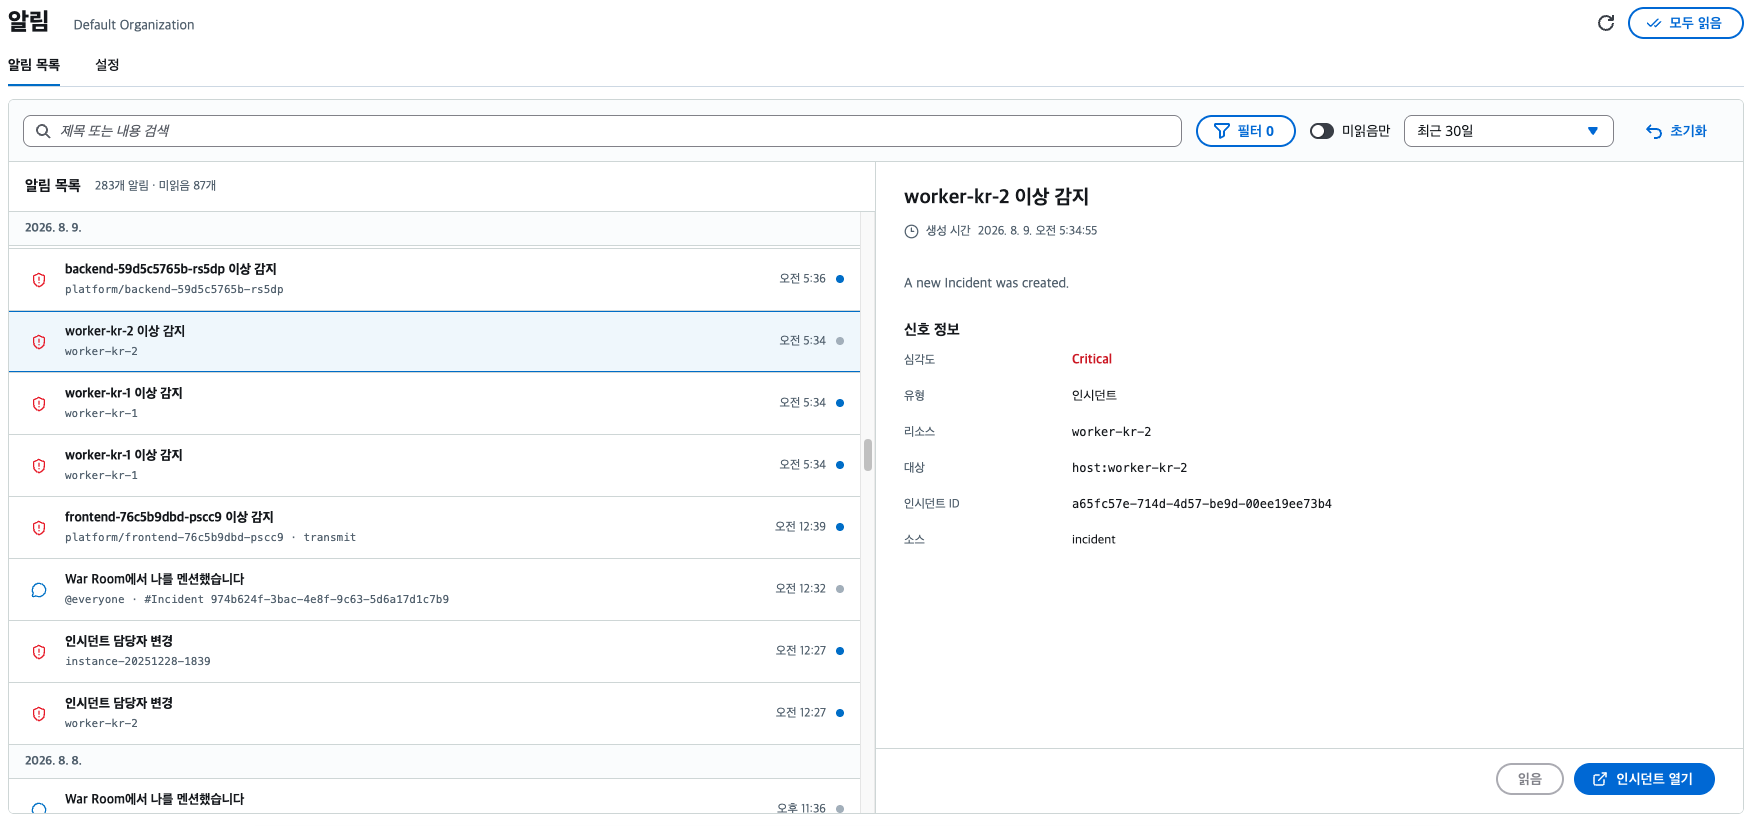
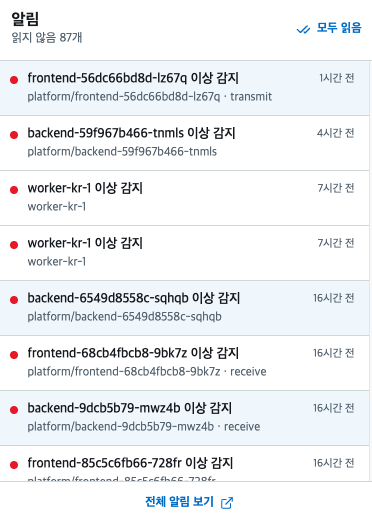
See new incidents, Connect collection status and War Room messages in one place. Filter notifications by severity, time, read status and keyword, then open the related Incident or War Room.
From observability to response
Monithub connects metrics, logs, traces and service dependencies in one Incident. Assess causes and impact from the same evidence. Keep the response and resolution on record for your next incident.
Adoption and technical inquiriessupport@monithub.io
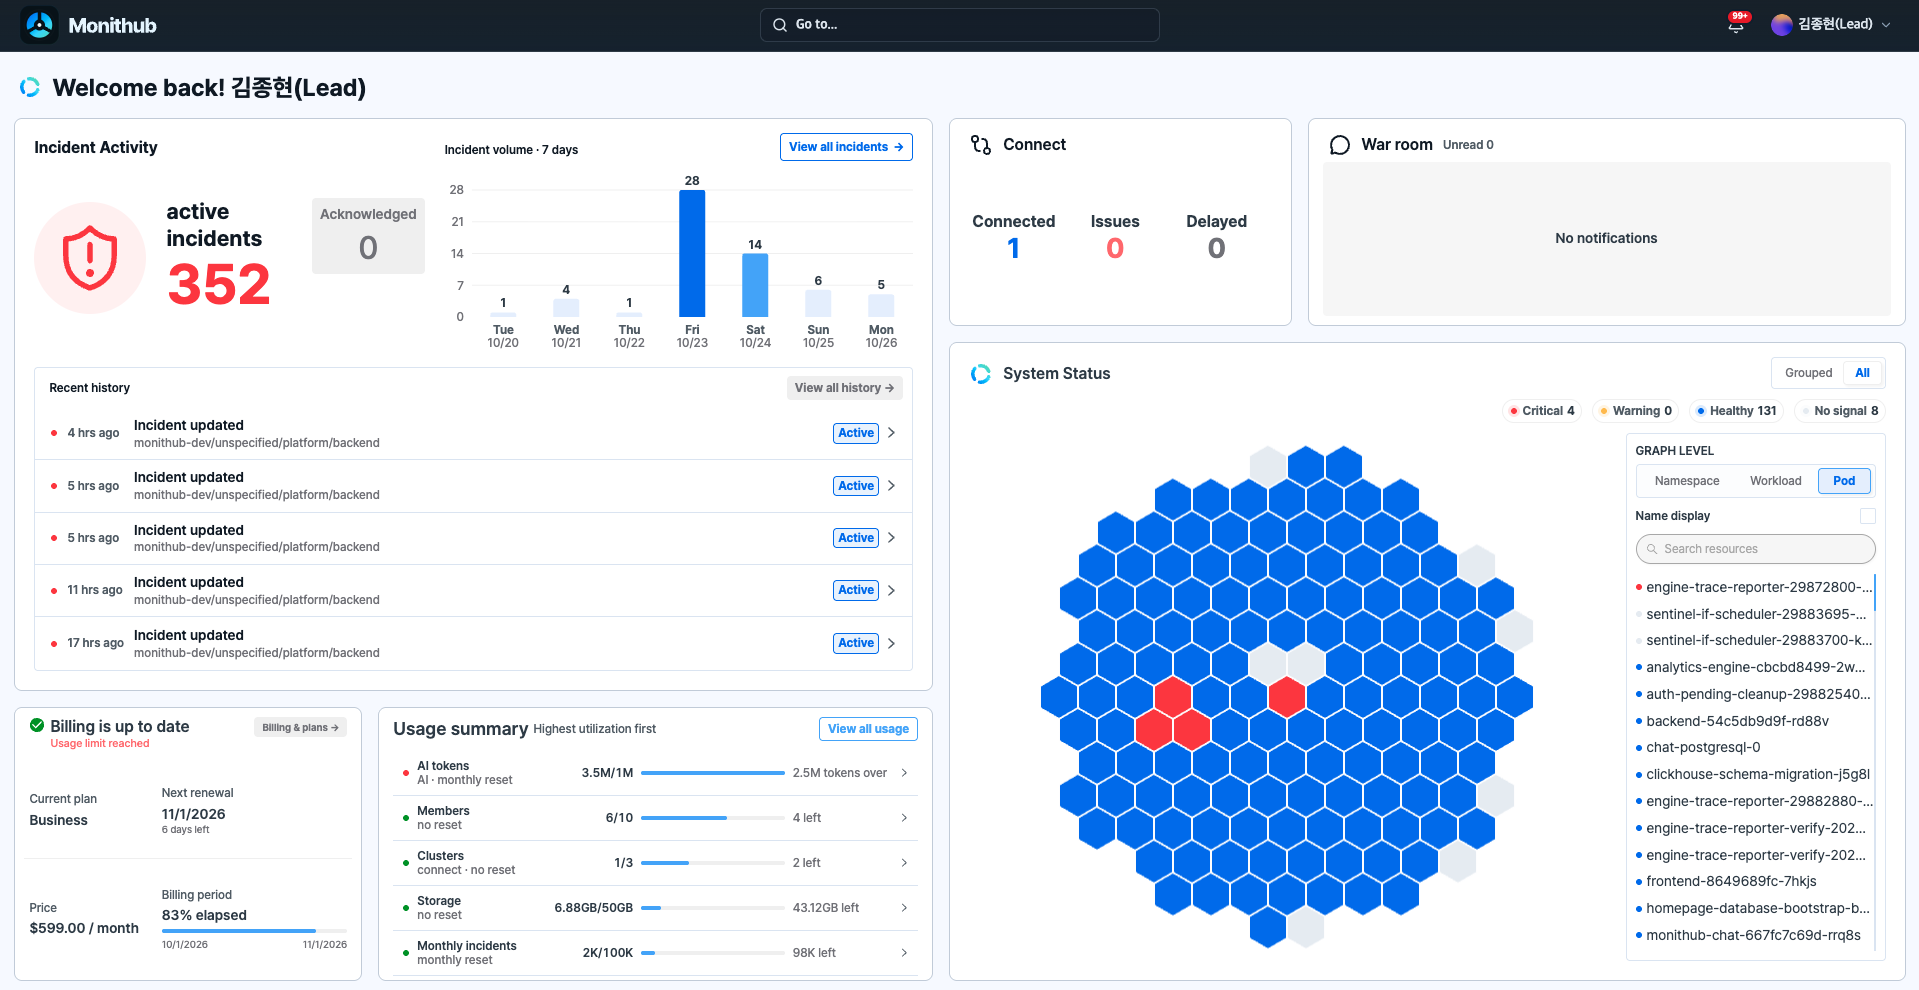
PROBLEM
When latency, error logs, failed calls and resource changes sit on separate screens, your team has to rebuild the context each time a problem appears. With decisions and discussions split across chat and documents, it's hard to keep track of who checked what and which actions worked.
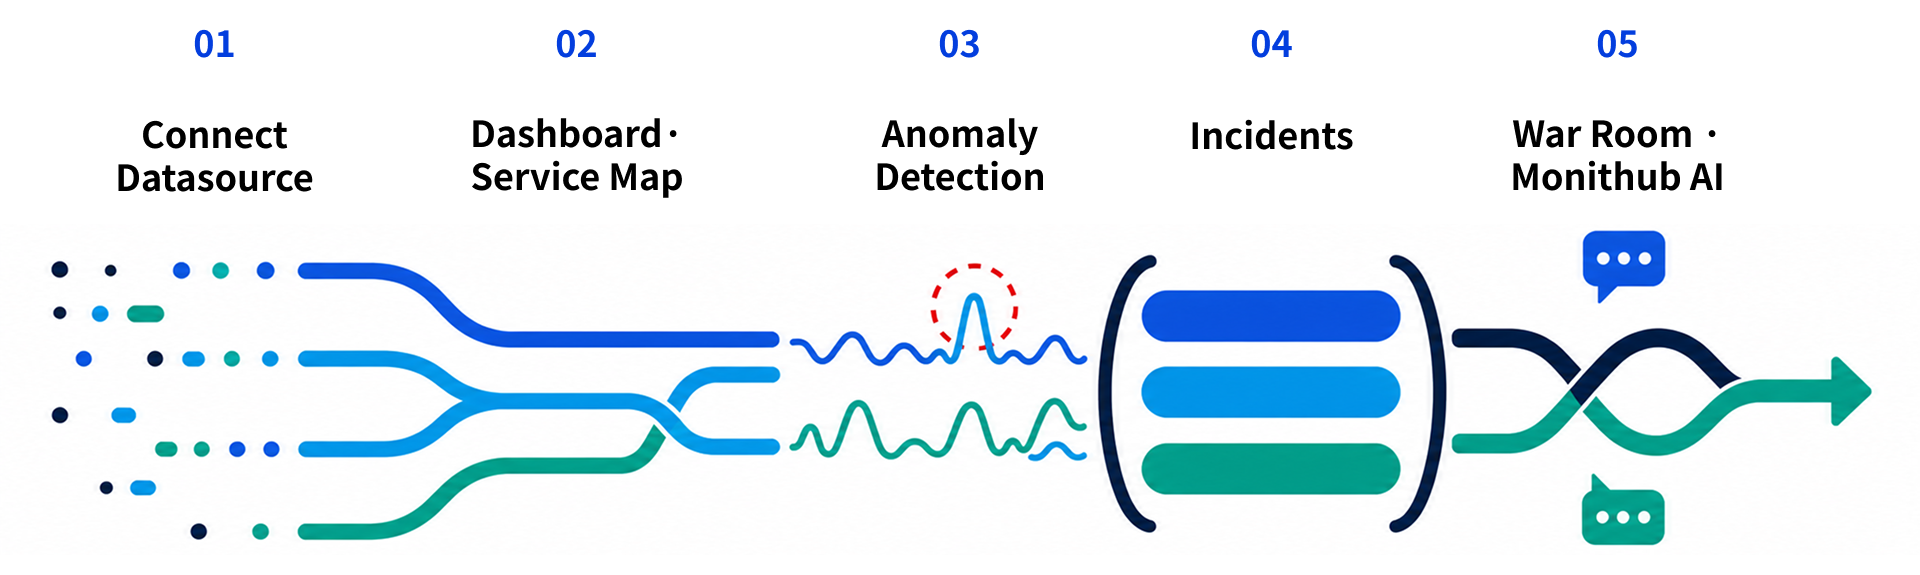
WORKFLOW
Review anomalies in notifications, narrow the impact in Service Map, then analyze related signals and the timeline in one Incident. Record the response from the same evidence and use the resolution results to improve detection.
Notifications
See new incidents, Connect collection status and War Room messages in one place. Filter notifications by severity, time, read status and keyword, then open the related Incident or War Room.
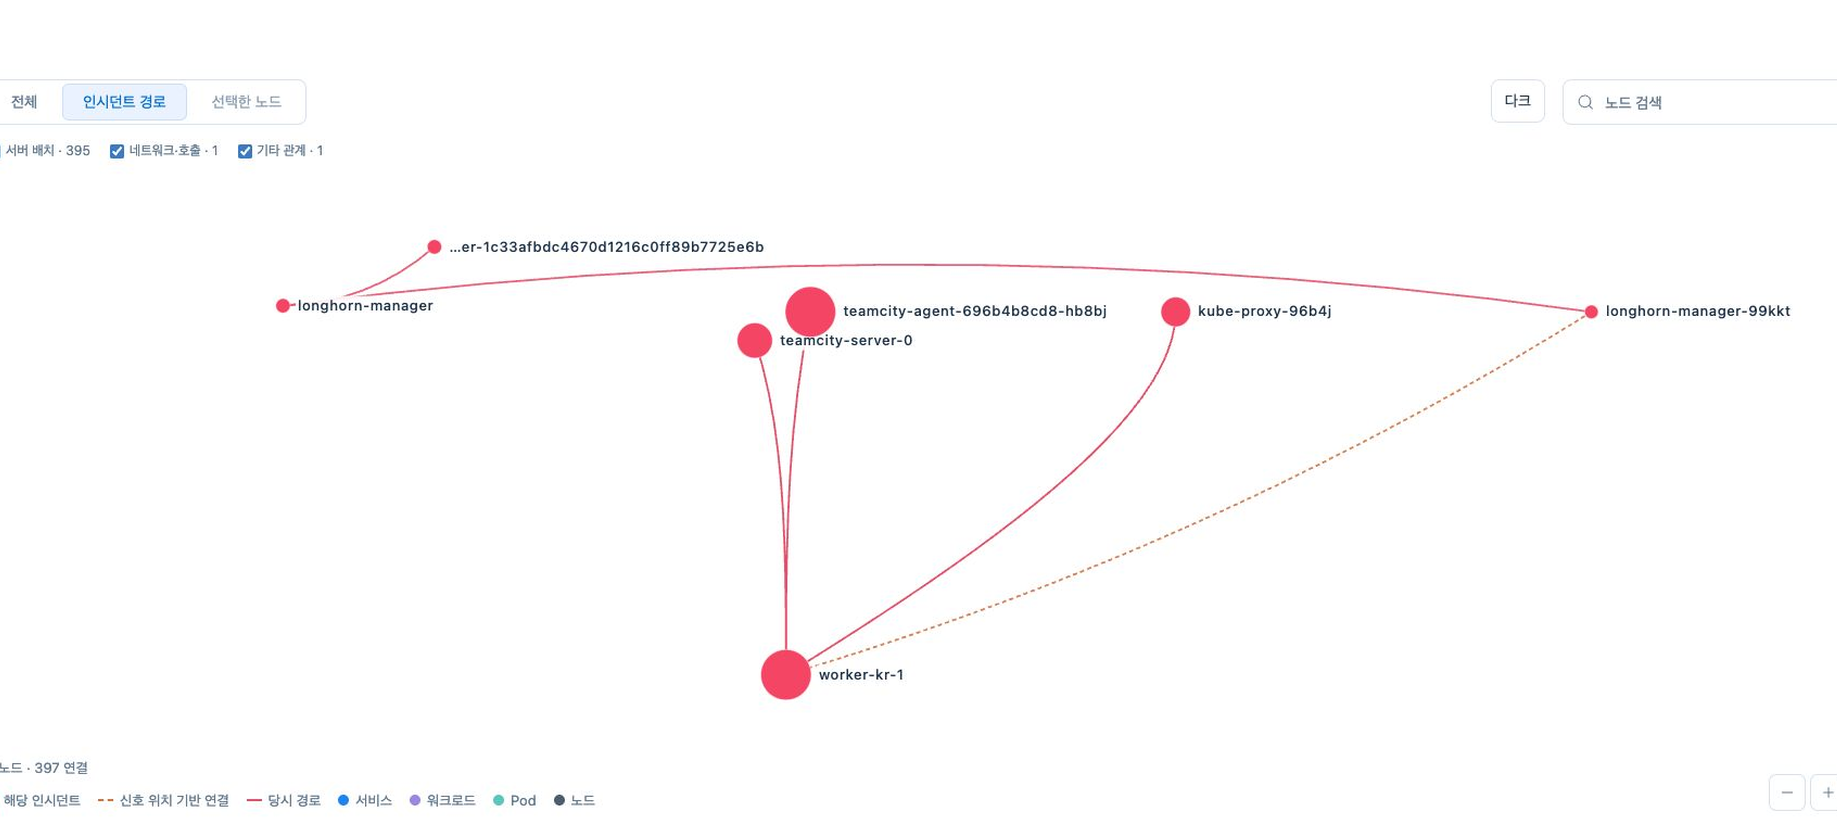
Impact
Find slow or failing connections in Service Map, then explore 1-hop and 2-hop upstream and downstream dependencies. Identify where the problem started and what else is affected to decide where to investigate next.
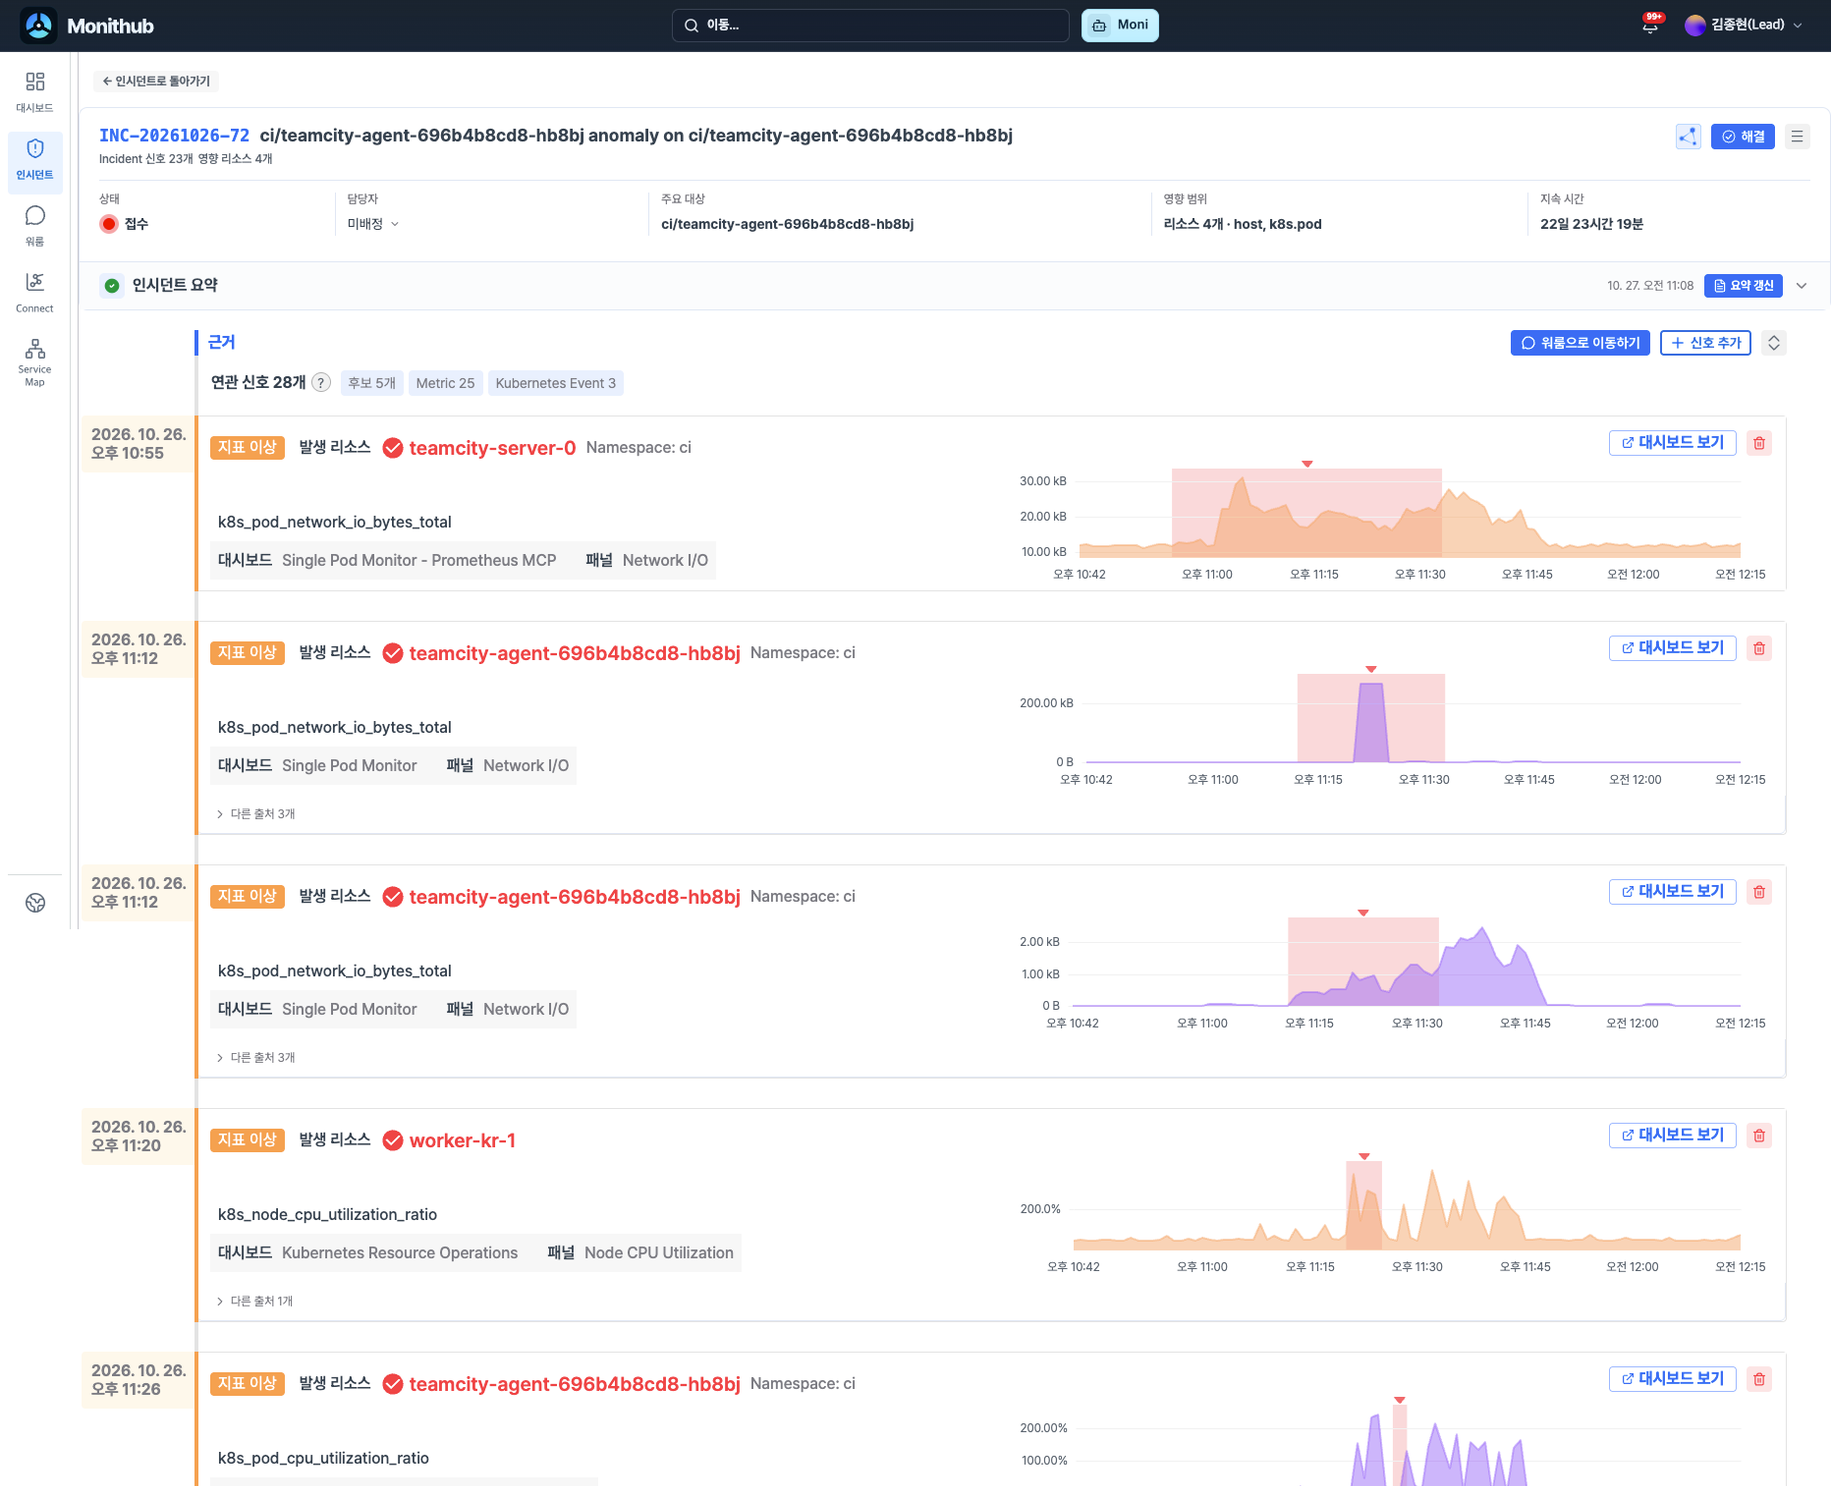
Incident
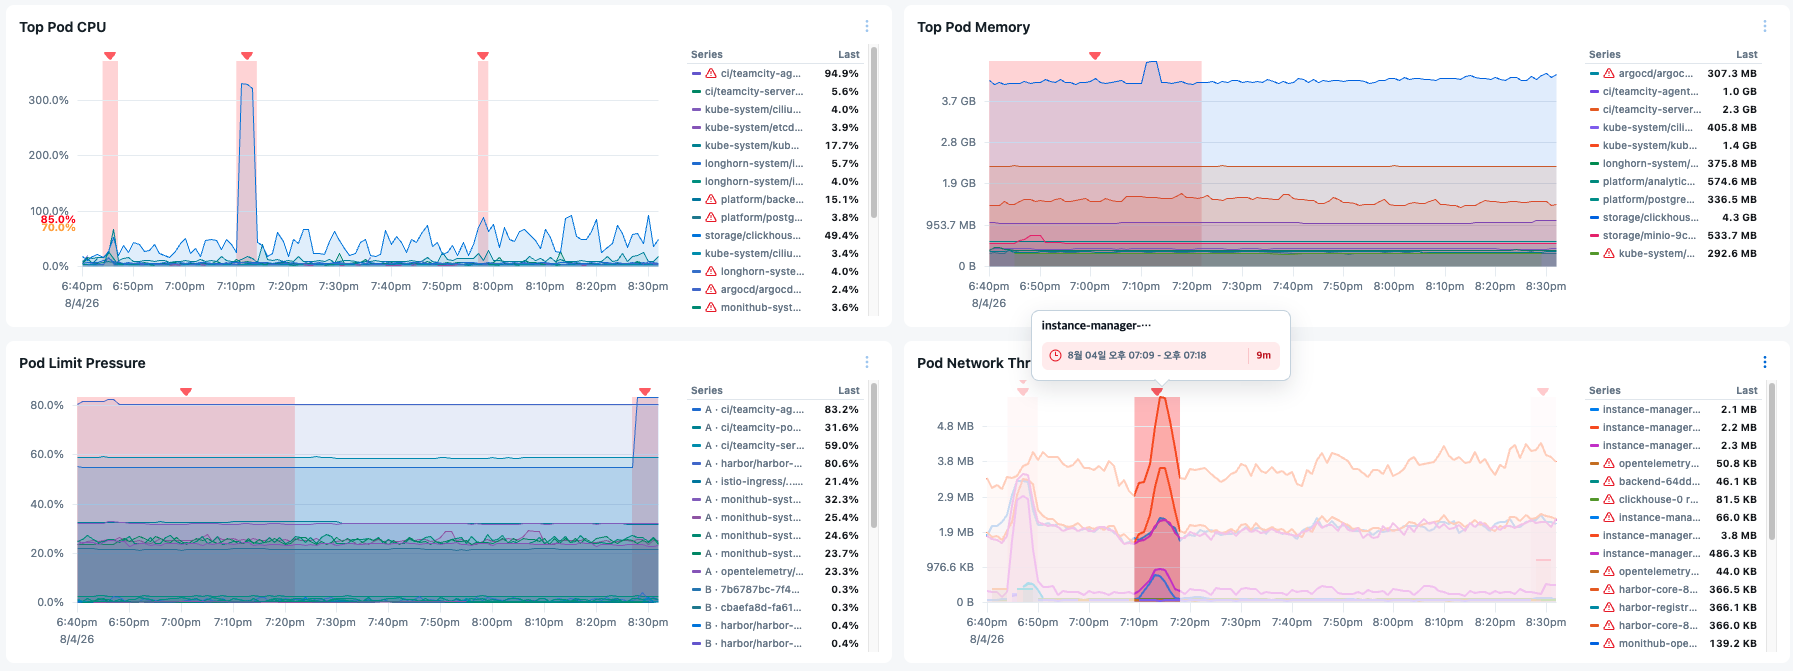
See status, severity, impact, owners and the timeline at a glance. Compare metrics, logs, traces and Kubernetes context to decide whether a problem needs attention now, who should check what, and when service recovered, with evidence to support each decision.
Response records
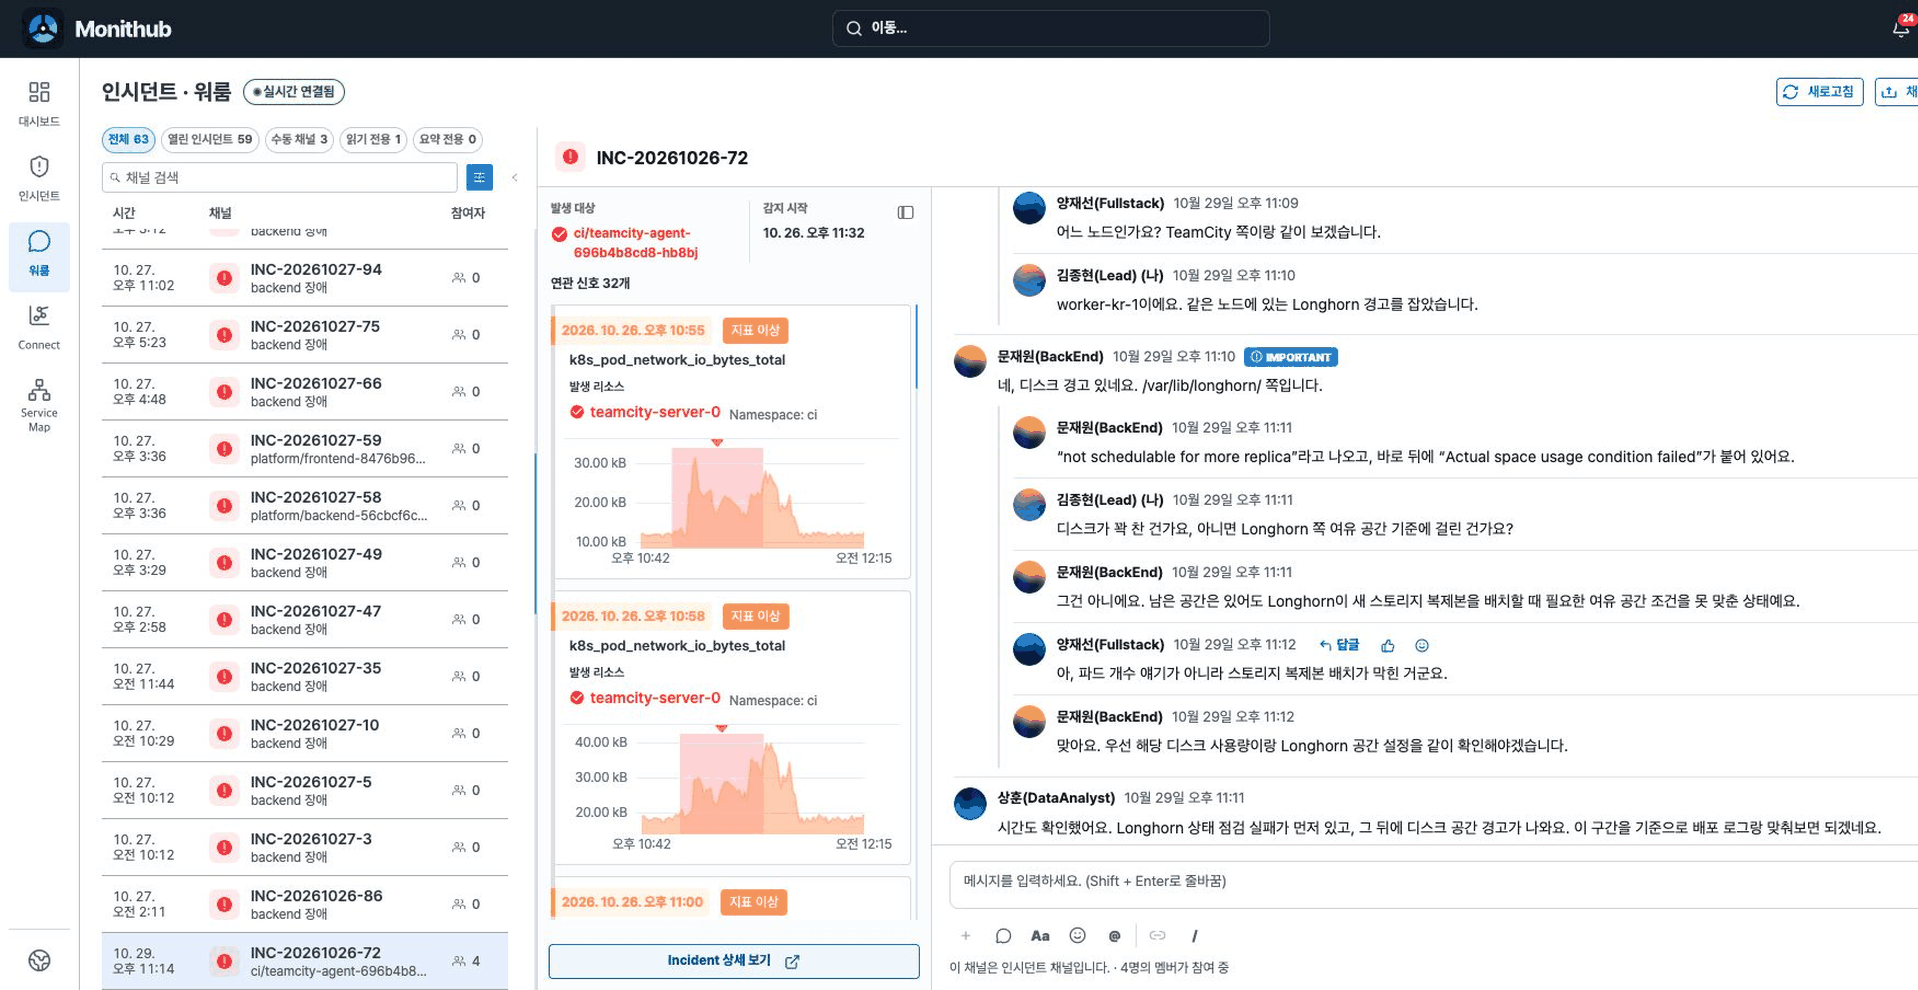
Bring responders into the War Room and keep confirmed facts, hypotheses, actions and results in the Incident context. Use AI summaries and briefings as drafts to organize long discussions, then compare them with the original messages and evidence before making the final call.
Detection improvement
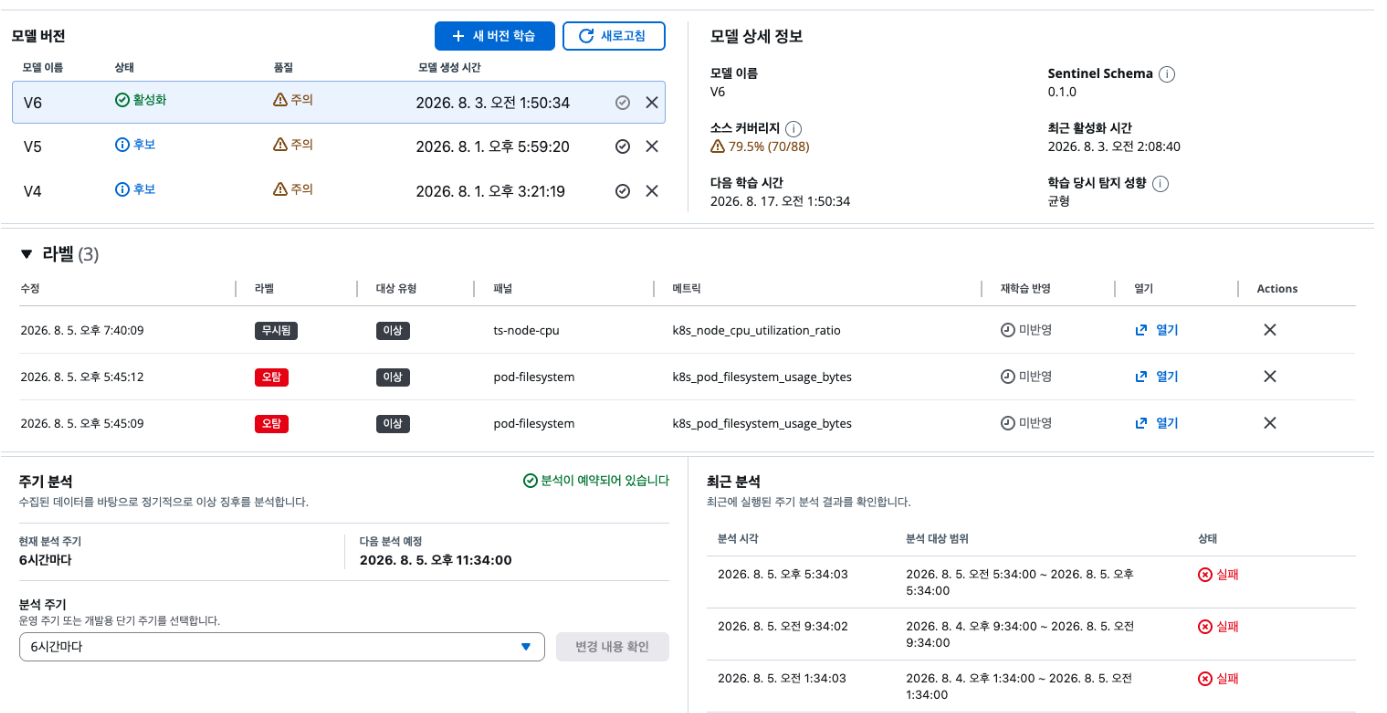
Build training data from confirmed detections, false positives, missed detections and resolution results. Compare and validate candidate models against the current model, then choose the version that better fits your operations to keep improving detection accuracy.
BETA
Enter your email and we'll send you a sign-up link. For adoption or technical evaluation inquiries, contact support@monithub.io.